How to Use Yahoo Finance for Stock Research, Portfolio Tracking, and Real-Time Market Data
Master Yahoo Finance for a seamless workflow in stock research, portfolio management, and real-time market data analysis. This comprehensive guide will walk you through setting up your portfolio, interpreting key metrics, and navigating recent UI updates.
Step-by-Step Yahoo Finance Portfolio Setup
- Sign in and Access My Portfolio: Sign in to Yahoo Finance (create an account if needed). Navigate to ‘My Portfolio’ from the top navigation bar. Tip: Bookmark the My Portfolio page for quick access.
- Create a New Portfolio: Click ‘Create Portfolio’. Enter a descriptive name (e.g., “Growth Portfolio 2025”) and select your base currency (USD, EUR, etc.). Tip: Descriptive names aid in portfolio organization and comparison.
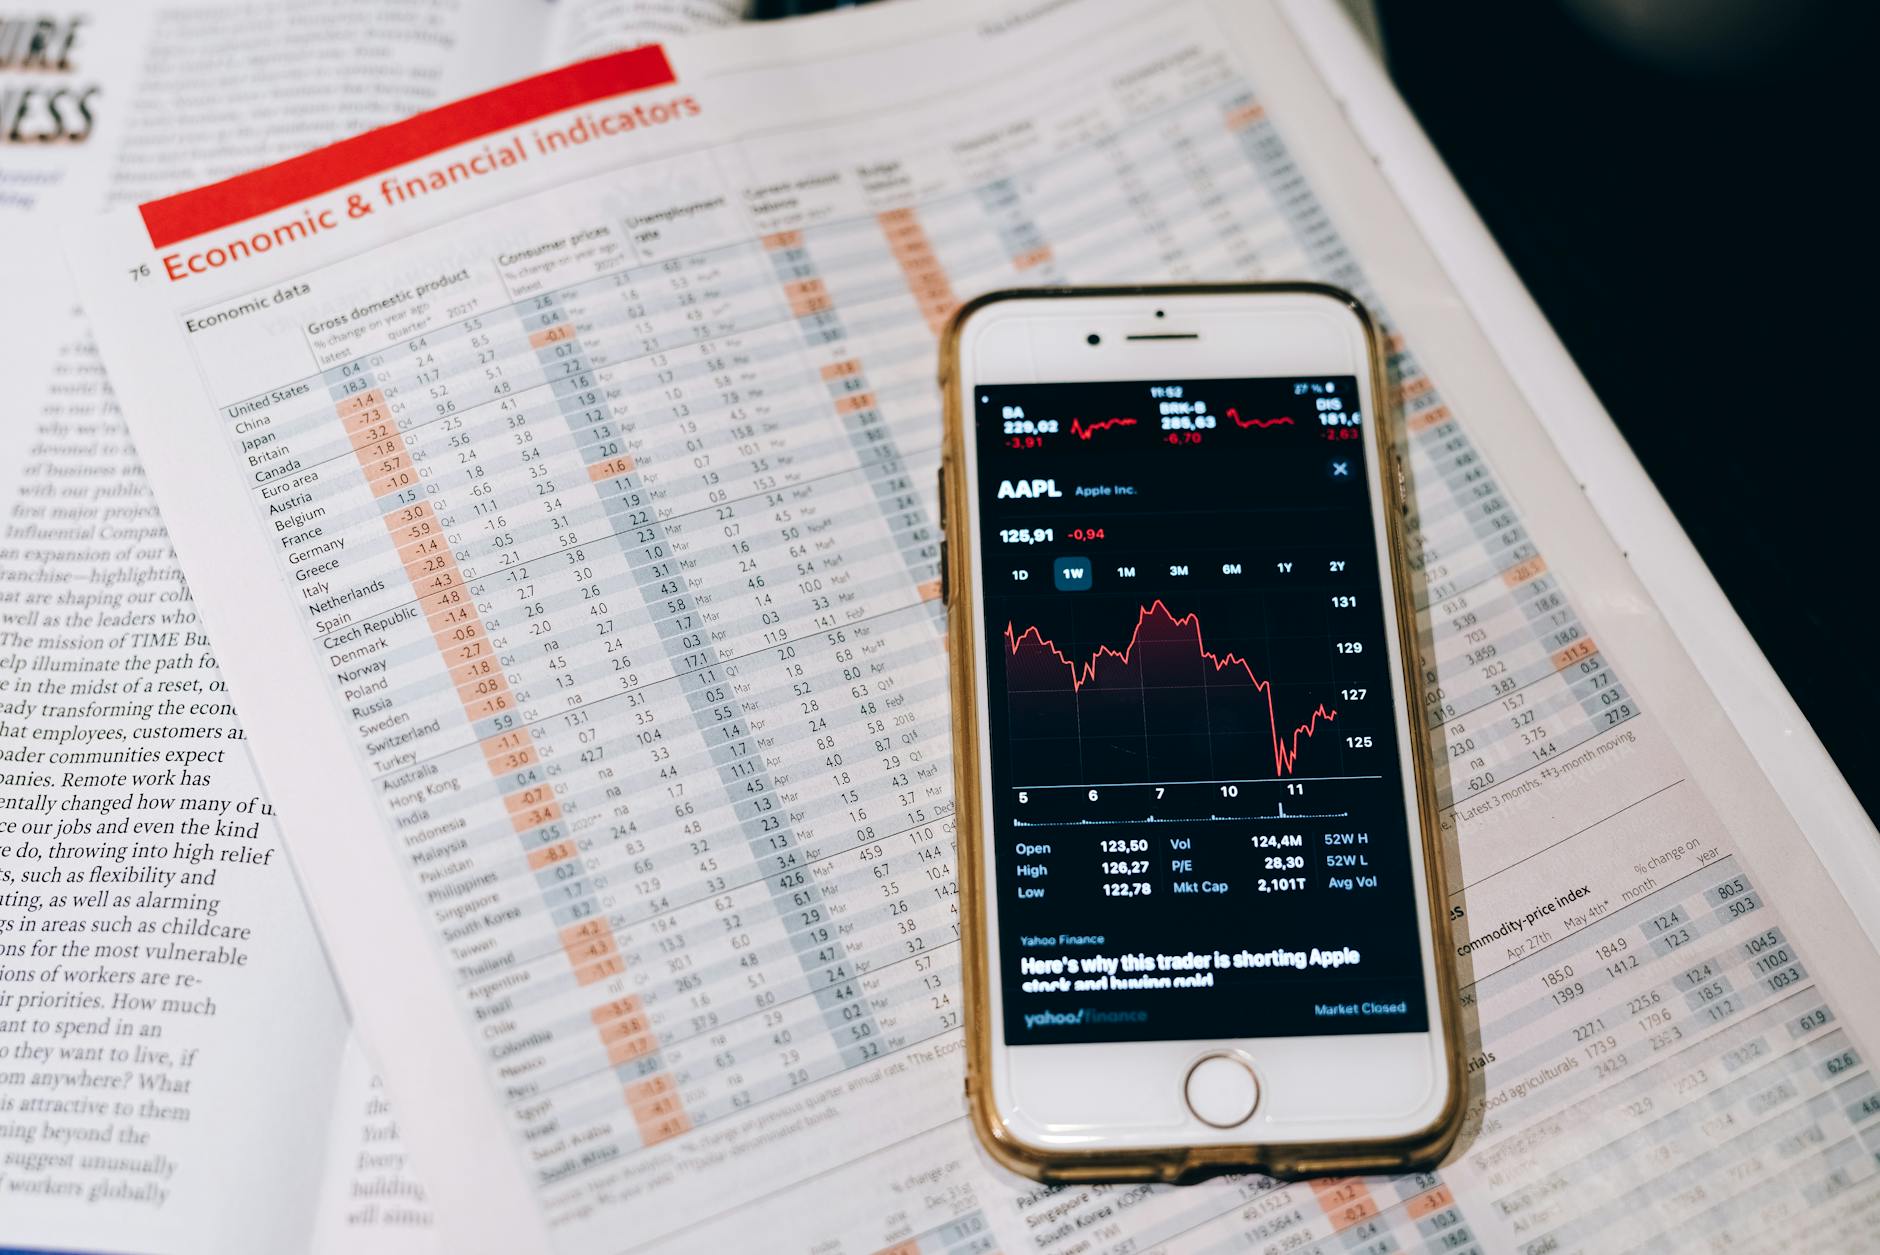
- Add Holdings: Click ‘Add Symbol’ and enter stock tickers (AAPL, MSFT, etc.). Input the number of shares, purchase price, and purchase date for each holding. Include any cash entries for available funds.Tip: Start with a few core holdings to test the layout.
- Tag Holdings: Categorize your holdings by asset class (Stock, ETF), sector, and region. This allows for efficient filtering and insightful analysis. Tip: Utilize tags like region (US, Europe) and asset class (stocks, bonds, cash) for enhanced filtering.
- Link Brokerage Account (Optional): Go to ‘My Portfolio’ then ‘Link Accounts’. Select your broker and complete the OAuth process. This enables automatic trade and balance updates. Tip: Availability varies by region and broker. Data sync frequency may differ.
- Configure Data Updates: Set your preferences for real-time quotes (where available), notification alerts for price changes, news, and dividends. Tip: Enable real-time quotes for timely market updates, if your subscription allows.
- Test the Refresh Cycle: Verify that your portfolio page accurately reflects color-coded performance updates (daily, 7-day, 1-month).
Interpreting Portfolio Metrics
Understanding portfolio metrics is key to making informed investment decisions. Here’s a breakdown of important metrics and their implications:
| Metric | What it Tells You | Actionable insights |
|---|---|---|
| Total cost vs. current market value | Shows unrealized gains or losses across positions, indicating potential rebalancing needs. | Spot overweight or underweighted positions; rebalance to manage risk. |
| Unrealized gains/losses | Indicates potential tax implications if sold; essential for year-end planning. | Plan year-end taxes; consider tax-loss harvesting. |
| Dividends and dividend yield | Tracks expected annual income and yield per position; valuable for cash flow planning. | Compare income generation across holdings; plan cash flow and reinvestment. |
| Asset allocation by class | Reveals concentration risk across asset classes. | Rebalance to your target allocation to reduce risk. |
| Sector diversification | Highlights overexposure to specific industries. | Adjust holdings to improve balance and reduce sector-specific risk. |
| Regional exposure | Shows geographic risk and currency considerations. | Align with global exposure goals and diversify to manage country-specific factors. |
| Performance visuals (YTD, 1-year, 3-year) | Identifies leading and lagging positions. | Trim laggards, reinforce winners, and rebalance based on long-term objectives. |
| Dividend dates and ex-dividend information | Informs reinvestment timing and cash flow around dividend events. | Schedule purchases and reinvestments to optimize income and tax timing. |
Navigating Yahoo Finance’s Historical Data Access (Update May 2024)
Yahoo Finance updated its UI in May 2024, affecting historical data downloads. Here are workarounds:
- History Tab Workaround: Access the ‘History’ tab for the desired ticker, select your date range, and try downloading the data again.
- Time Series View Export: Use the export/download option within the ticker’s ‘Time Series’ view.
- Long-Form Data Function: Utilize a function that fetches and organizes Yahoo Finance data into a consistent CSV format (date, open, high, low, close, adj_close, volume, ticker).
Real-Time Data: Considerations
Real-time data availability depends on your region, subscription (Yahoo Finance Pro), and broker integration. Free users typically experience delayed quotes.
| Aspect | Free Tier | Yahoo Finance Pro or Supported Brokers |
|---|---|---|
| Real-Time Availability/Latency | Quotes delayed up to 15 minutes. | Real-time quotes for selected markets. |
| Region Coverage | Limited real-time coverage (primarily US and parts of Europe). | Broader real-time data access across supported markets. |
| Data Types | Equities, ETFs, futures, options; crypto data varies by region. | Equities, ETFs, futures, options; crypto data varies by region. |
| Broker Linkage | Limited real-time data access. | Improved real-time data access and features. |
Remember to verify your region and subscription level for optimal real-time data access.
Practical Walkthroughs
These practical examples illustrate key tasks within Yahoo Finance’s portfolio management tools.
Adding Tickers, Setting Cost Basis, and Viewing Performance
- Add a Symbol: In ‘My Portfolio’, click ‘Add Symbol’, enter the ticker, select the correct security, and input shares, price, and date.
- Set Cost Basis: Select the appropriate cost basis method for accurate P/L reporting.
- View Performance: Switch to the ‘Performance’ view to compare daily, weekly, monthly, and YTD performance.
Linking a Brokerage Account
- In ‘My Portfolio’, select ‘Link Accounts’.
- Choose your broker and authorize access via OAuth.
- Verify that balances and positions populate correctly.
- Enable automatic updates for near real-time data synchronization.
Rebalancing Your Portfolio
Regularly review your asset allocation and rebalance as needed. Use a 5-10 percentage point delta from your target allocation as a trigger for rebalancing.
| Asset Class/Sector | Target Allocation | Current Allocation | Delta |
|---|---|---|---|
| US Stocks | 40% | 46% | +6% |
| International Stocks | 20% | 18% | -2% |
| Bonds | 30% | 28% | -2% |
| Alternatives/Cash | 10% | 8% | -2% |
Prioritize trimming high-cost or high-risk assets and reinvesting in underrepresented areas.
Pros and Cons of Using Yahoo Finance
Pros:
- Comprehensive stock research data
- User-friendly portfolio builder
- Integrated watchlists, news, and charts
- Free access to market data
- Dividend tracking and performance visuals
Cons:
- UI changes affecting historical data downloads
- Real-time quotes may require a paid subscription
- Limited broker and region support
- Can be cluttered for beginners
Leave a Reply